Appearance
Collecting Data from Routers
In the DMP Client Router App, the Enable Monitoring checkbox must be selected (it is selected by default) to collect data from the device. The Monitoring Interval (15 minutes by default) controls how often data is reported.
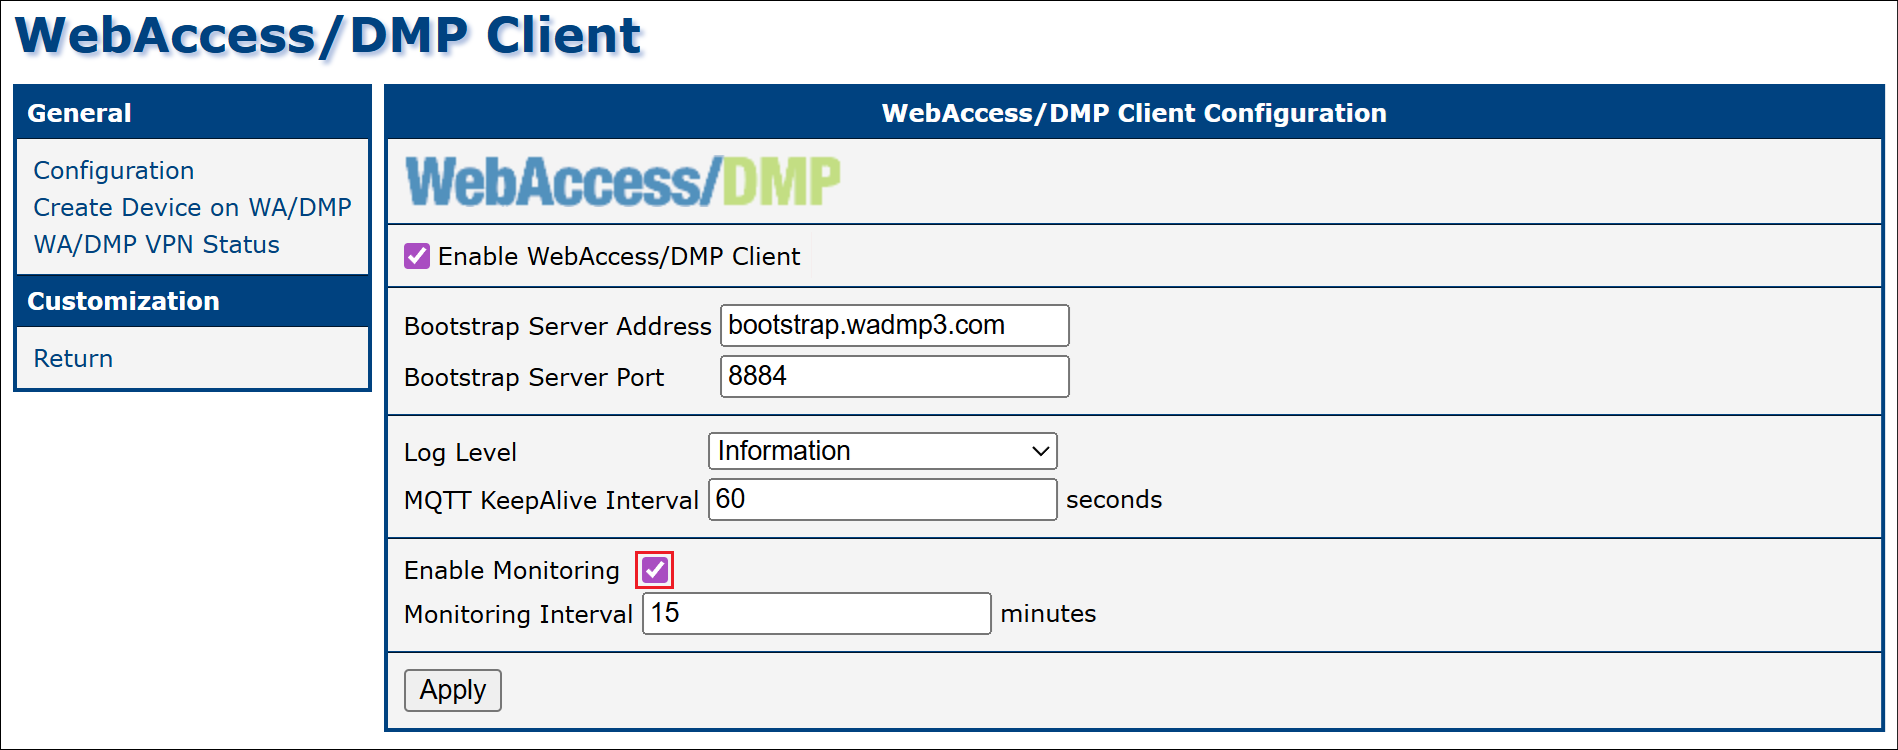
You can disable monitoring on a device by clearing the checkbox and clicking Apply, or leave monitoring enabled and adjust the interval instead.
Note
Monitoring data is collected only while the device is online. Nothing is buffered on the device while it is offline, so no data is reported for the time a device was disconnected.
The monitoring interval can affect your cellular data bill — a shorter interval means data is sent more frequently. The amount of data in each message also depends on the Fields configured for your company, which can affect the bill as well (see the example below).
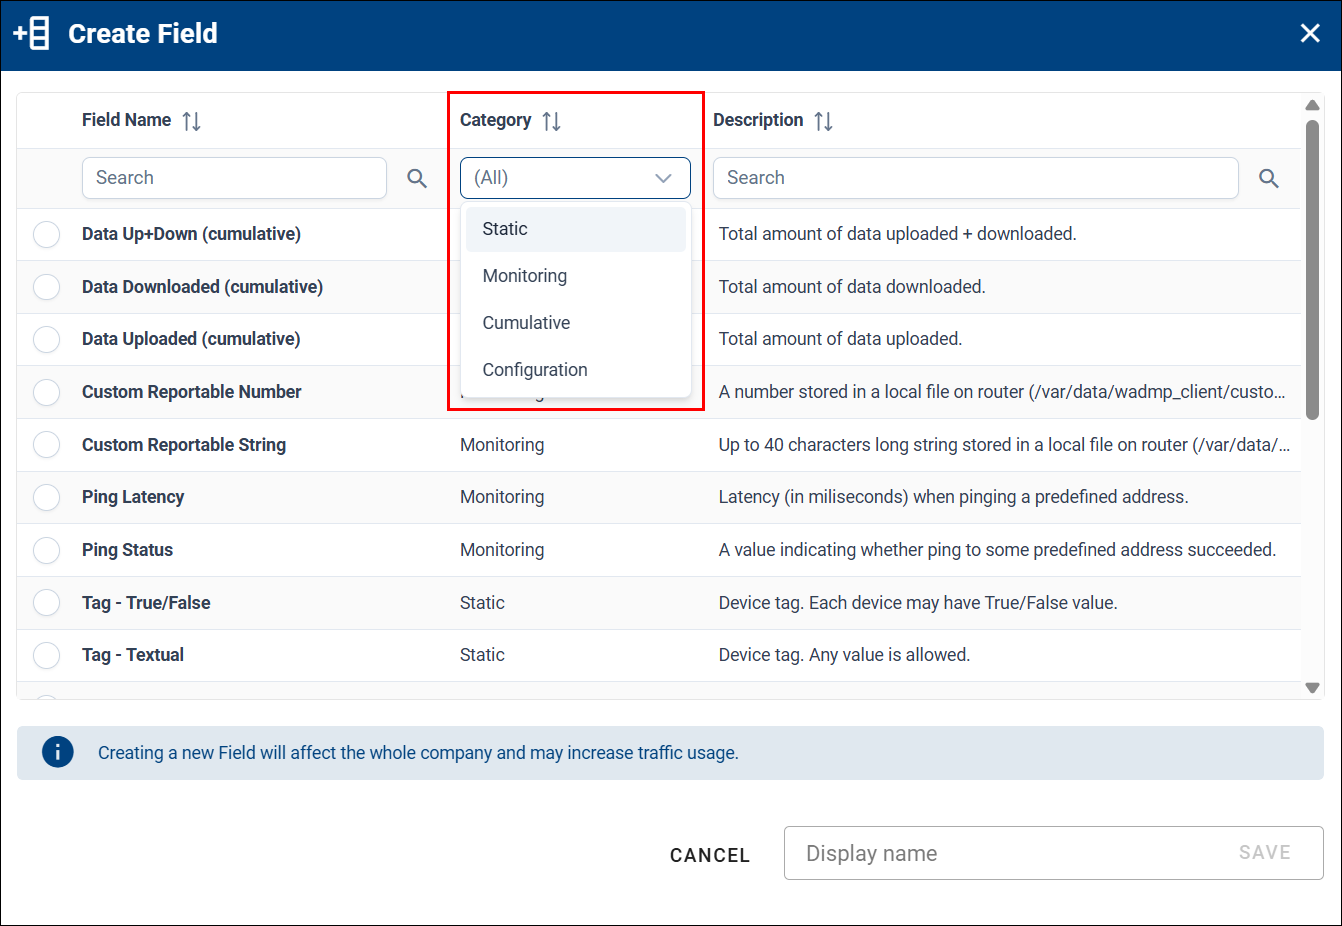
Fields have different categories that you can filter by, but monitoring (representation in Stats, Charts, and Tables) generally works across all Field types, including Configuration. Adding a Field means it is tracked in the database, and some fields consume more cellular data when reported.
How Device Data Reporting Works
The WebAccess/DMP client maintains a TCP connection with the WebAccess/DMP management server. This keeps the device always connected, so it can be reached immediately when needed.
Maintaining an always-on TCP connection has a cost: packets must be sent periodically to keep the connection alive. Because most devices connect to WebAccess/DMP over cellular, the network provider (carrier) charges for all data exchanged — even TCP keepalive data, not just application data.
The amount of data consumed depends on the type of Field used. For some Fields you can set the reporting behavior (Always, Never, or On Change with a threshold). For examples of how much data specific actions use, see the FAQ.
Example: Monitoring Cellular Data Usage
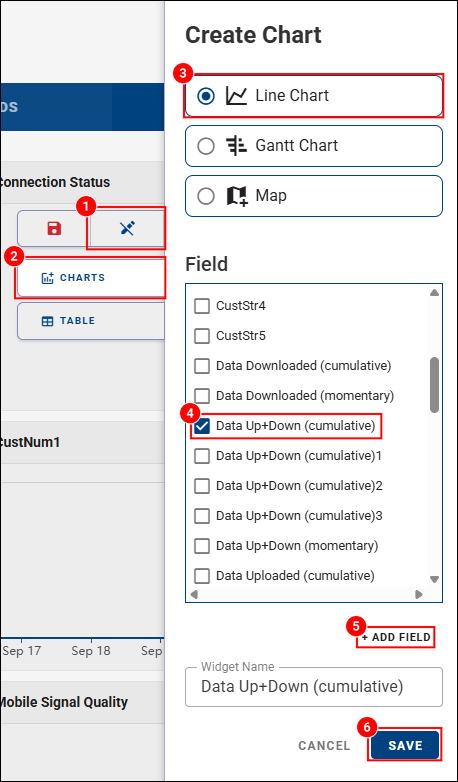
You can observe actual cellular data usage on the Monitoring tab of a device. Make the Data Up+Down field visible in the table (click the eye icon) and add charts for it. See Dashboards & Widgets for more on working with widgets and tables.
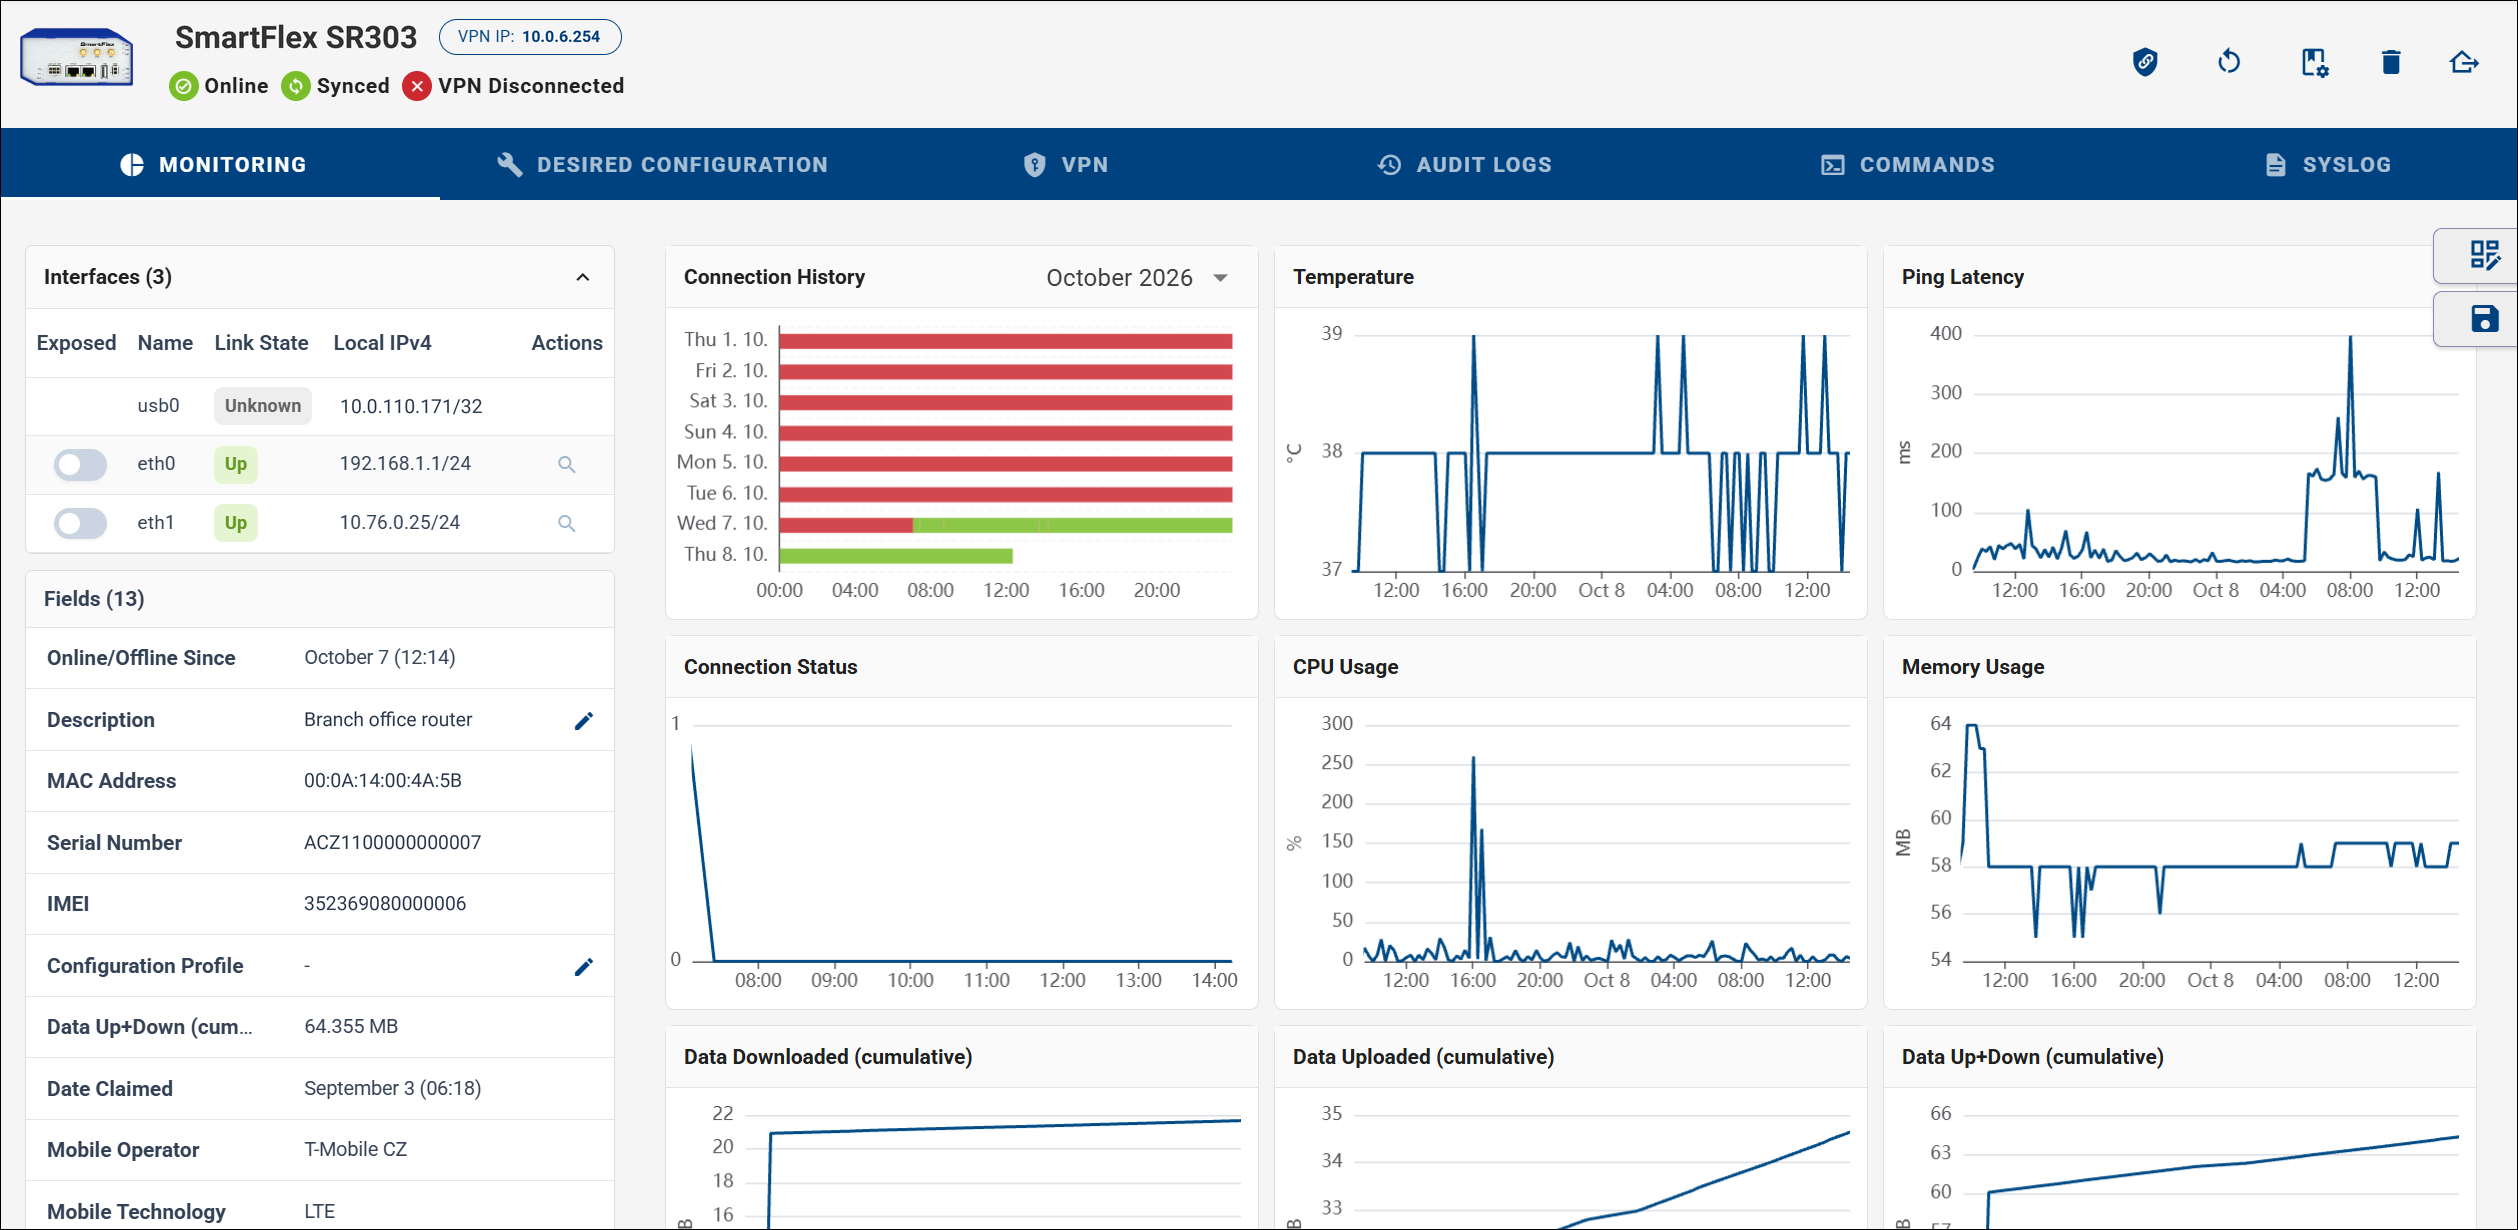
Similarly, you can observe data for all devices in the company on the main dashboard — here using the Max aggregation of the Data Up+Down field with a Line Chart. You can add multiple fields of the same type with different aggregations to the same chart (for example, Max and Average together).
Ping Status and Ping Latency
These Fields monitor connectivity to a specified IP address. Provide the IP address when creating the Field:
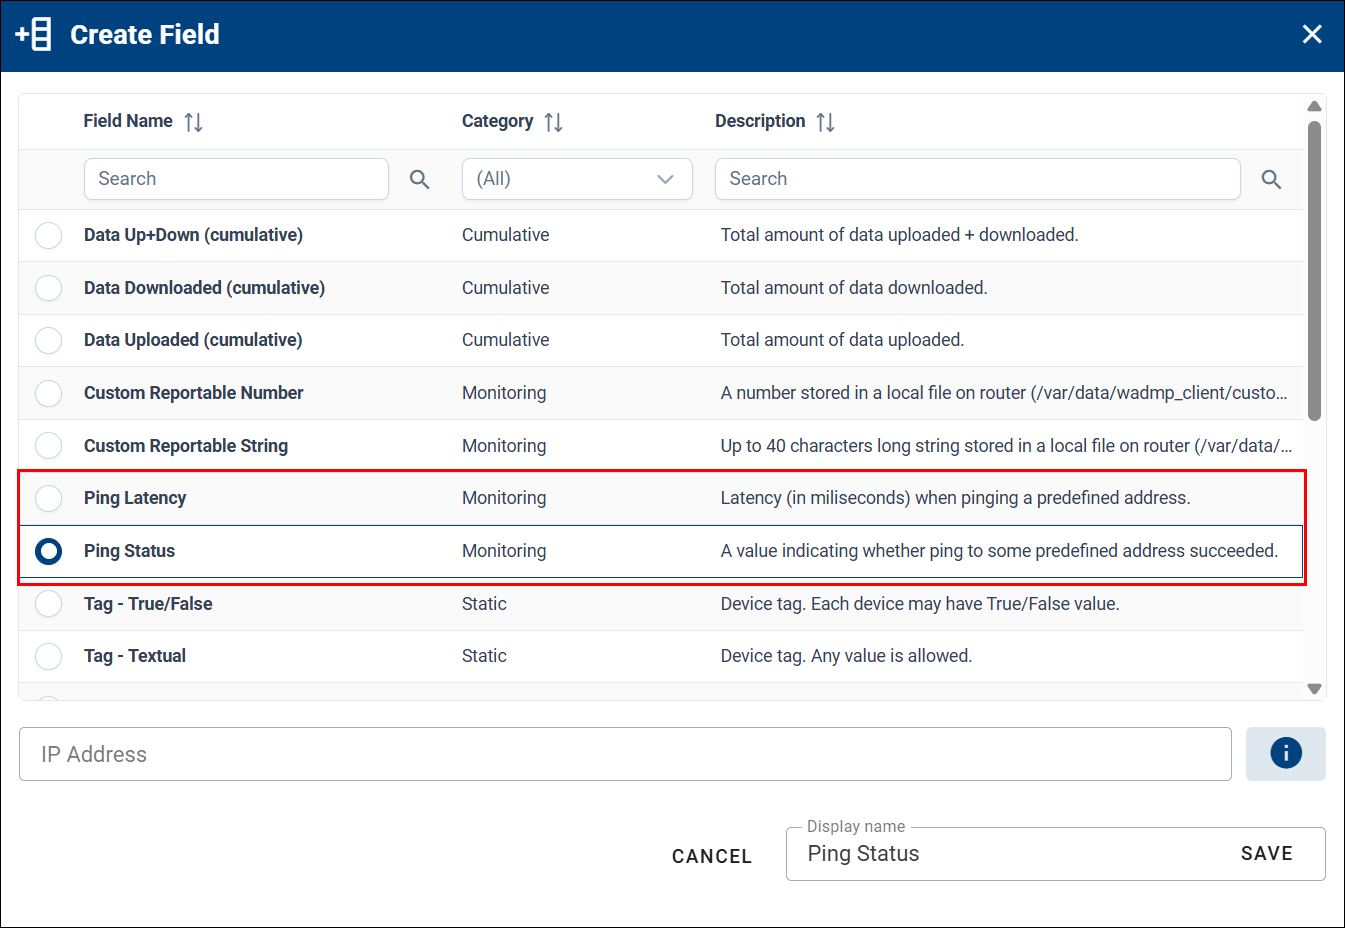
- Ping Status — A True/False value indicating whether a ping to the predefined address succeeded.
- Ping Latency — The latency (in milliseconds) when pinging the predefined address.
Reported monitoring data can be used in widgets (Stats or Charts) or in the device Table on dashboards.
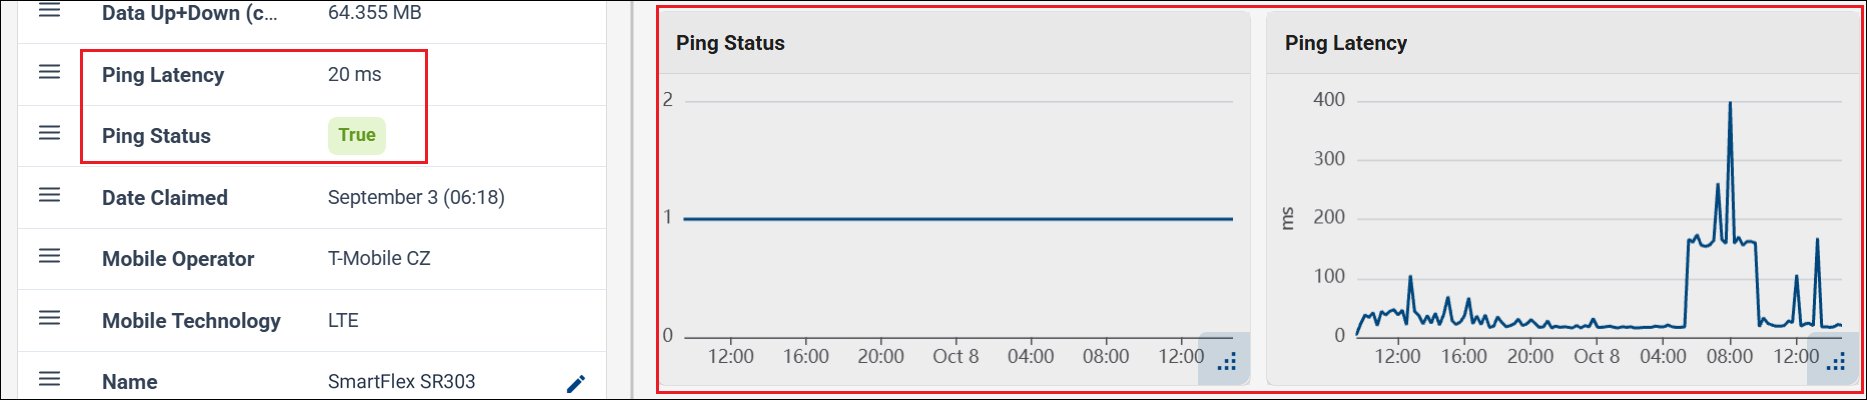
Example of ping Fields shown in the Table and added as Line Charts on the Device Monitoring tab:
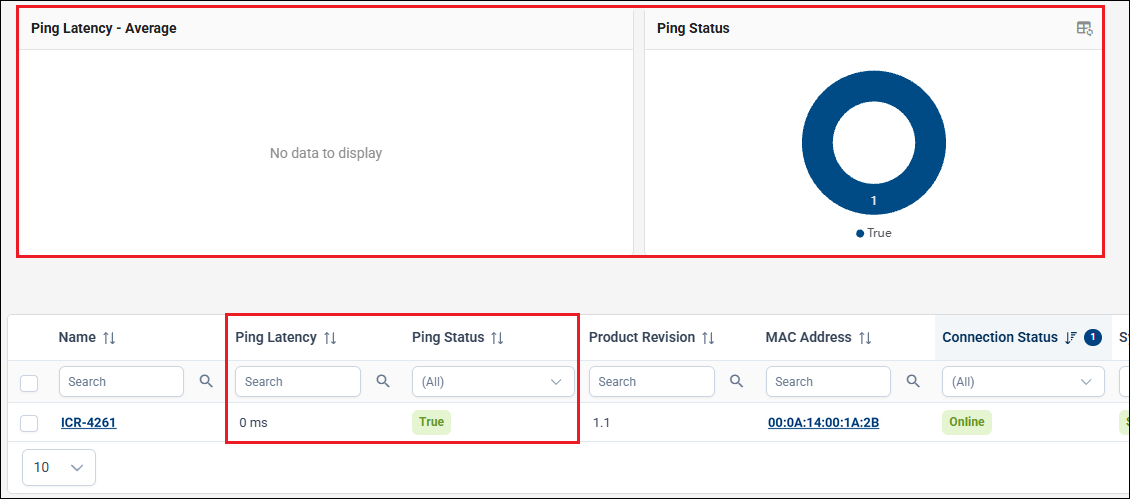
Example of ping Fields shown in the Table on the company dashboard, with Ping Latency added as a Company Stat and Ping Status as a Pie Chart:
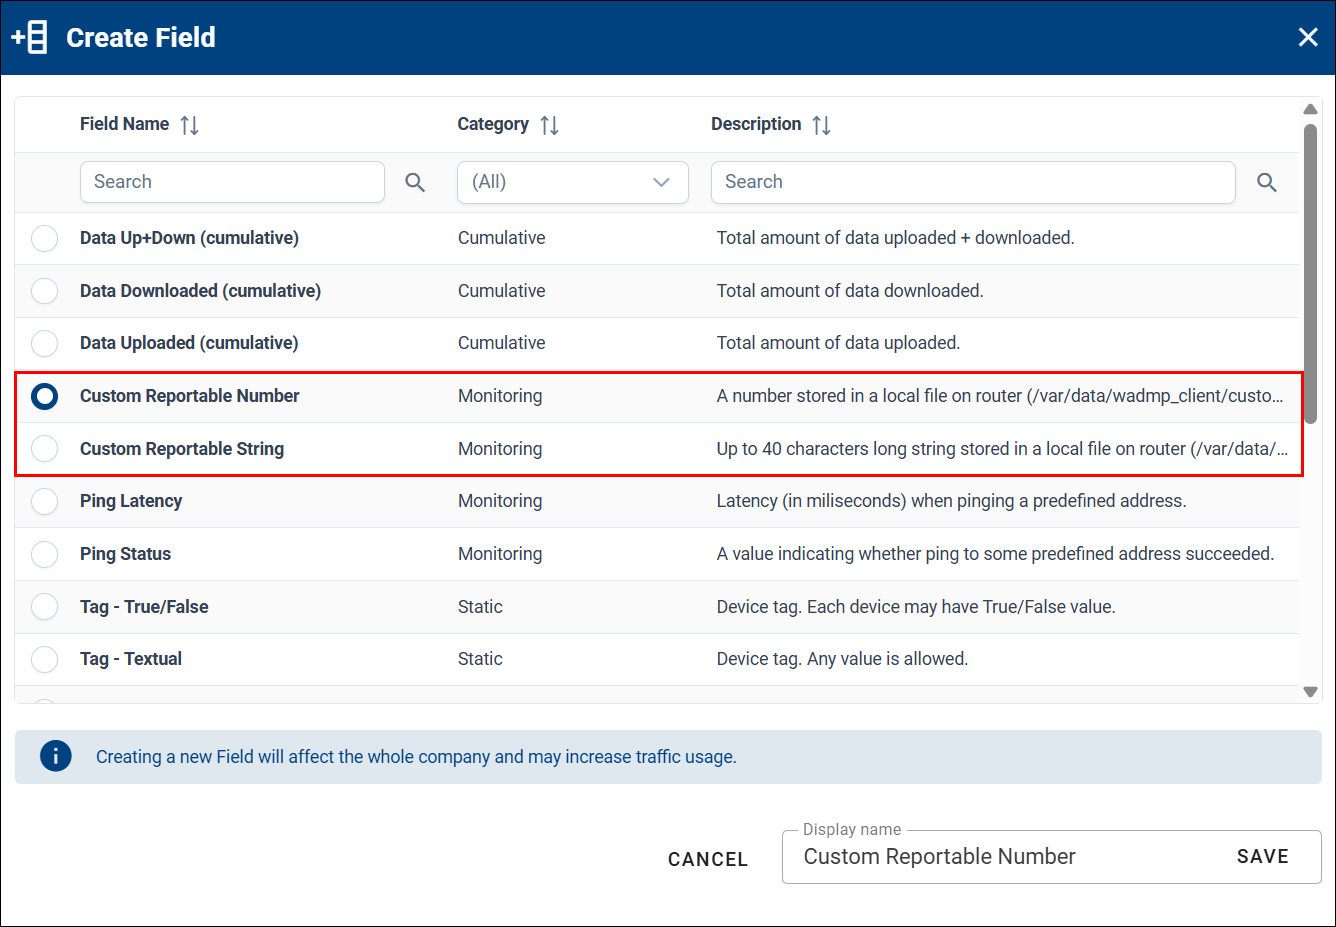
Custom Reportable String and Custom Reportable Number
These Fields can be programmatically connected to any string or number reported from the device, for example via a script.
- Custom Reportable String — A string of up to 40 characters, stored in a local file on the router and reported. Files are located at
/var/data/wadmp_client/custom_metrics/custom_str1throughcustom_str5. Up to five custom strings can be added. - Custom Reportable Number — A number stored in a local file on the router and reported. Files are located at
/var/data/wadmp_client/custom_metrics/custom_number1throughcustom_number5. Up to five custom numbers can be added.
Note
Only the Custom Reportable Number field can be used in charts; string data cannot be shown in charts.
Custom Fields can also be used with a sensor connected to the router (via RS232/485, binary I/O, or another industrial interface). For example, if a flow meter is connected, a script on the device can write the sensor value to a file; that value can then be reported to WebAccess/DMP and presented as data in Stats, Charts, or Tables, exported, or used for Alerts.
Download Speed Reporting — Example Using Custom Reportable Number
Add the following code as a Startup Script (for example, in Device Configuration):
bash
#!/bin/sh
# -----------------------------------------------------------------------------
# Initialization Script
# -----------------------------------------------------------------------------
# This script will run *after* all other init scripts and is intended to set up
# a custom metric collection script that downloads a file and logs download speed.
# -----------------------------------------------------------------------------

# -----------------------------------------------------------------------------
# Create the metric collection script
# -----------------------------------------------------------------------------
cat << 'EOF' > /var/scripts/script.sh
#!/bin/bash

# URL of the file to be downloaded
url="http://ipv4.download.thinkbroadband.com/10MB.zip"

# Define the directory and file path for storing metrics
dir_path="/var/data/wadmp_client/custom_metrics"
file_path="$dir_path/custom_number1"

# -----------------------------------------------------------------------------
# Ensure the required directory and file exist
# -----------------------------------------------------------------------------
# Check if the directory exists; if not, create it
if [ ! -d "$dir_path" ]; then
    mkdir -p "$dir_path"
fi

# Check if the file exists; if not, create it
if [ ! -f "$file_path" ]; then
    touch "$file_path"
fi

# -----------------------------------------------------------------------------
# Download the file and measure download speed
# -----------------------------------------------------------------------------
echo "Downloading 10MB file..."

# Perform the download and capture the average download speed in bytes/sec
speed_bytes=$(curl -o /dev/null --silent --write-out "%{speed_download}" "$url")

# Verify if a valid speed value was captured
if [[ -z "$speed_bytes" ]]; then
  echo "Error: Speed not found in response"
  exit 1
fi

# Convert the speed from bytes/sec to megabytes/sec
mbps=$(awk "BEGIN {printf \"%.2f\", $speed_bytes / 1024 / 1024}")

# Output the download speed in MBps
echo "Average download speed: $mbps MBps"

# Write the download speed to the specified file
echo "$mbps" > "$file_path"
EOF

# -----------------------------------------------------------------------------
# Make the script executable
# -----------------------------------------------------------------------------
chmod +x /var/scripts/script.sh

# -----------------------------------------------------------------------------
# Schedule the script to run daily using cron
# -----------------------------------------------------------------------------
# Append the script to the root crontab to execute at midnight daily
echo "0 0 * * * root /var/scripts/script.sh" >> /etc/crontab

# -----------------------------------------------------------------------------
# Ensure the cron service is started
# -----------------------------------------------------------------------------
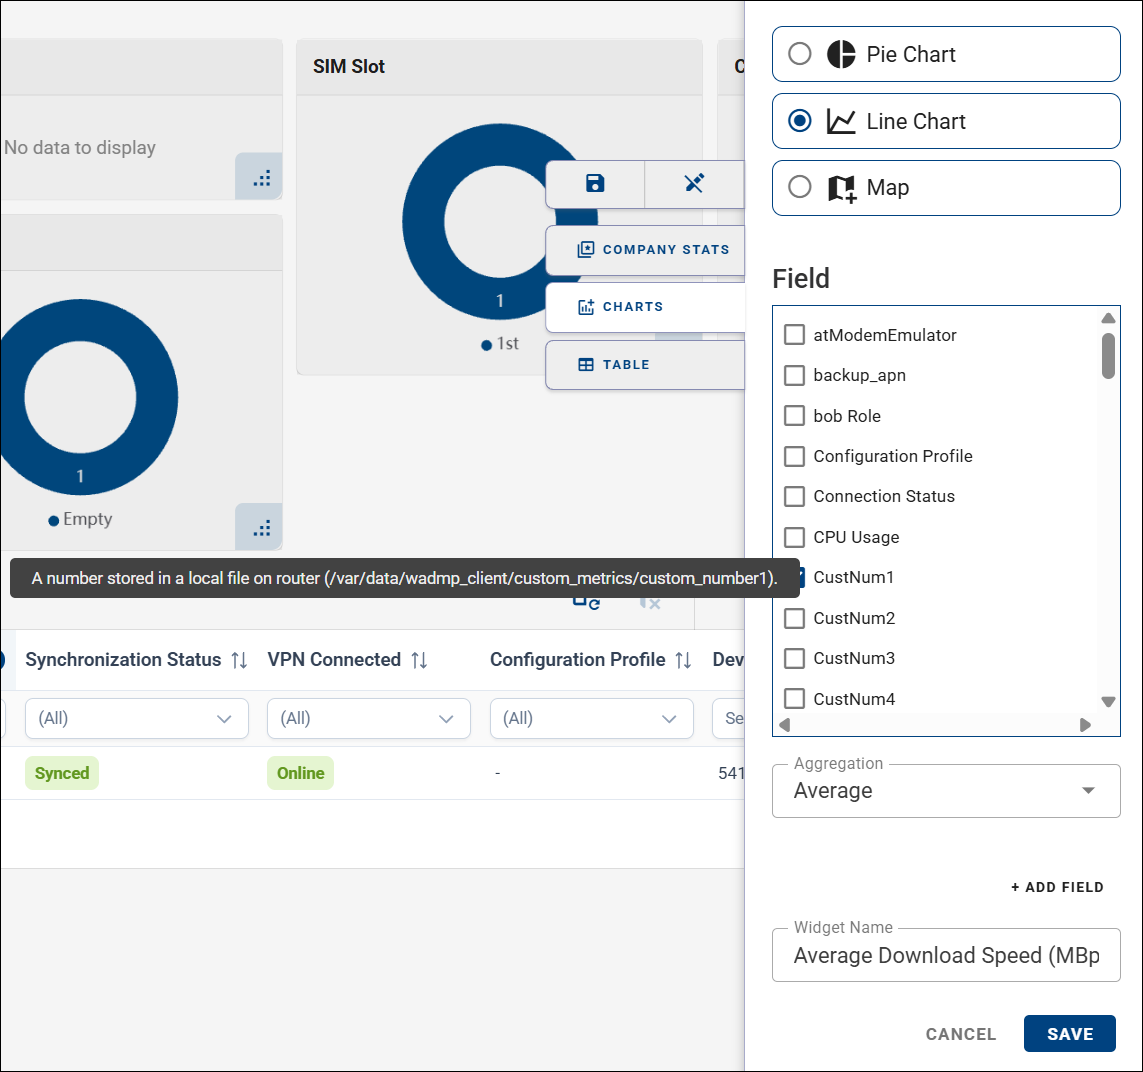
service cron start- To show the number on a dashboard (table column, Stat, or Chart), ensure the Custom Reportable Number field is added. If using multiple Custom Reportable fields, ensure the path shown in the description matches the
file_pathin the script (custom_number1). - To add a chart, select Line Chart and select the Custom Reportable Number field:
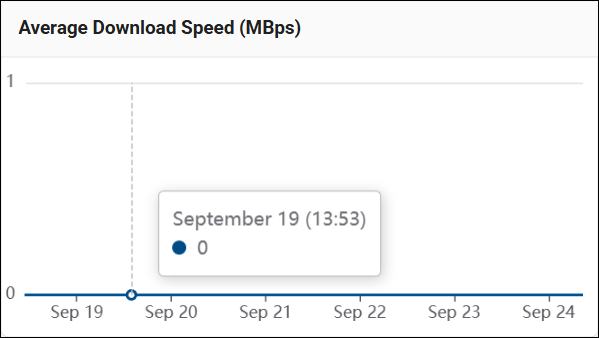
- The chart may then look like this: